How to Configure Alarm Server on a VIGI NVR
Contents
Scenario 1. Without attached image
Scenario 2. With attached image
Event Type and Event Subtype Values
Introduction
The Alarm Server feature is designed to receive event messages proactively reported by VIGI NVRs when alarm events are triggered.
The information included in the report will be gradually enriched as the device-side software version is updated, including event type, event timestamp, device details, and an optional event snapshot image.
This feature enables seamless alarm linkage and business processing between VIGI NVRs and third-party systems.
In addition to explaining how to configure the Alarm Server feature on a VIGI NVR, this article provides troubleshooting guidelines for potential issues, such as server connection failures, abnormal event reporting, and server-side parsing errors.
Requirements
- VIGI NVR (with Alarm Server support)
- Alarm Server
- Laptop
Configuration
Step 1. Build the topology according to the topology diagram below.
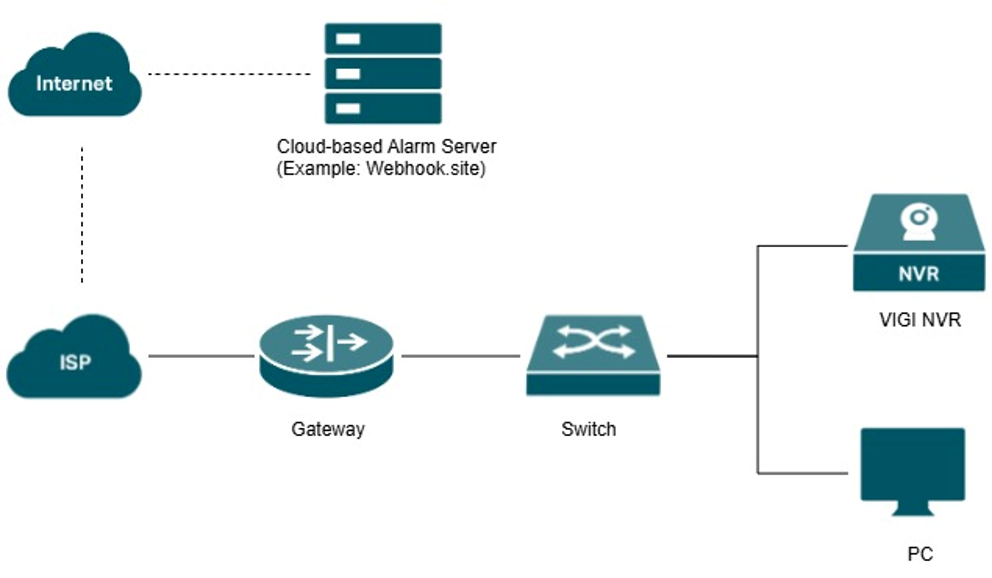
Note: The topology shown in this article is for reference purposes only. Actual deployment scenarios are more diverse.
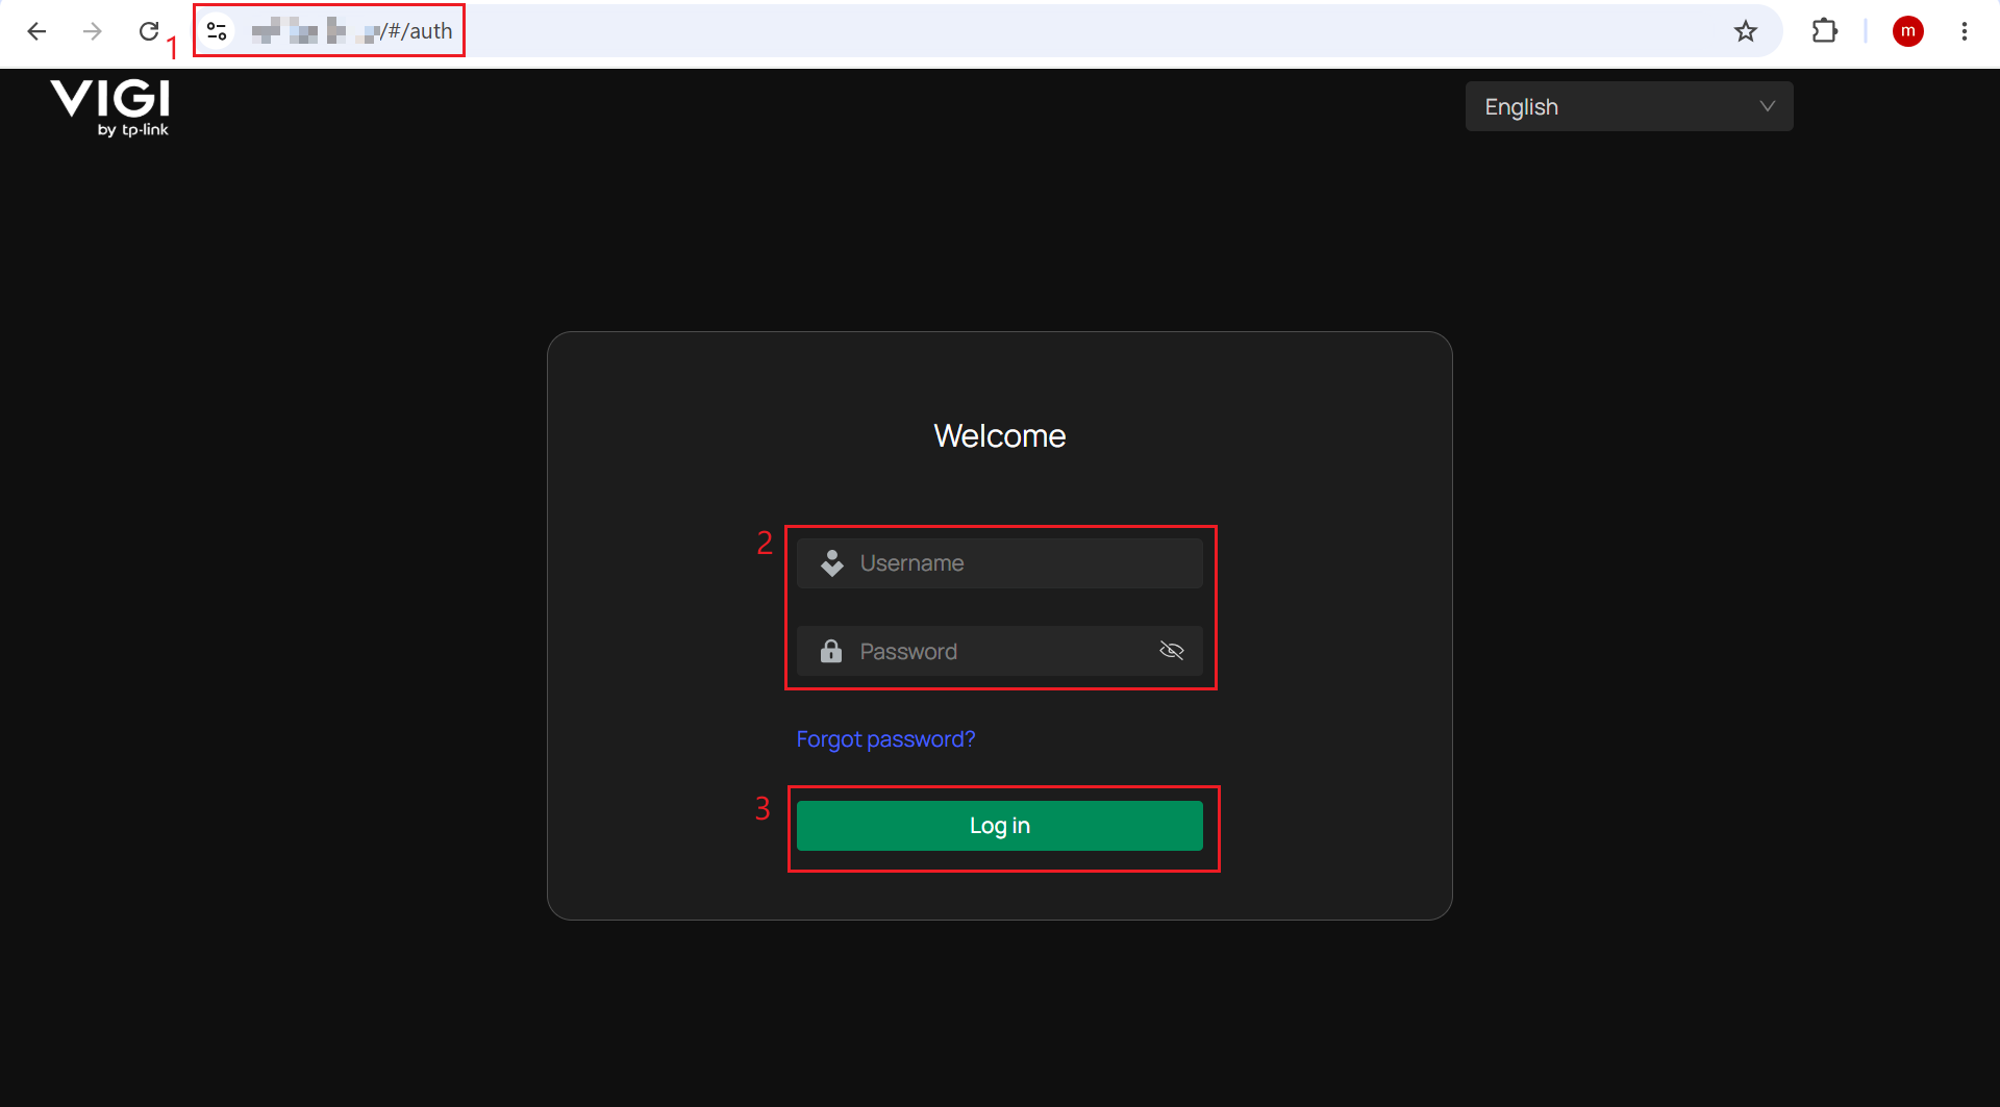
Step 2. Log in VIGI NVR’s web interface with its’ IP address. Enter the Username and Password, click Log in.
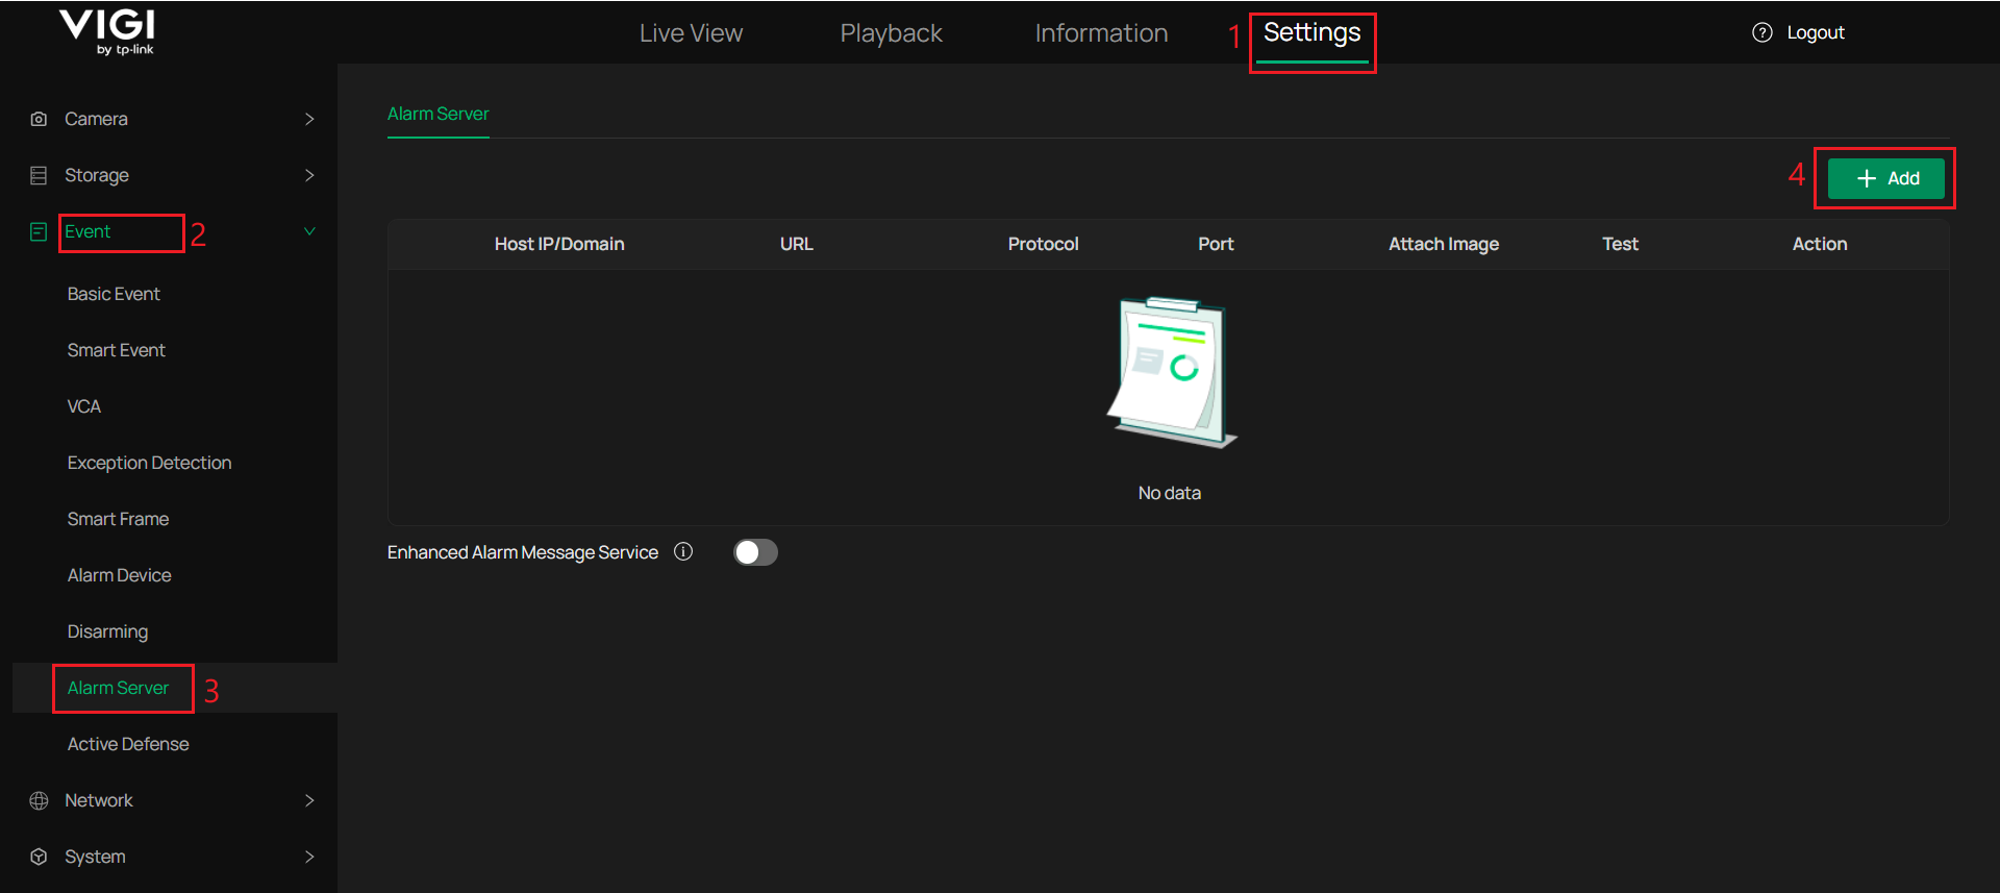
Step 3. Navigate to Settings > Event > Alarm Server, click “+Add” button.
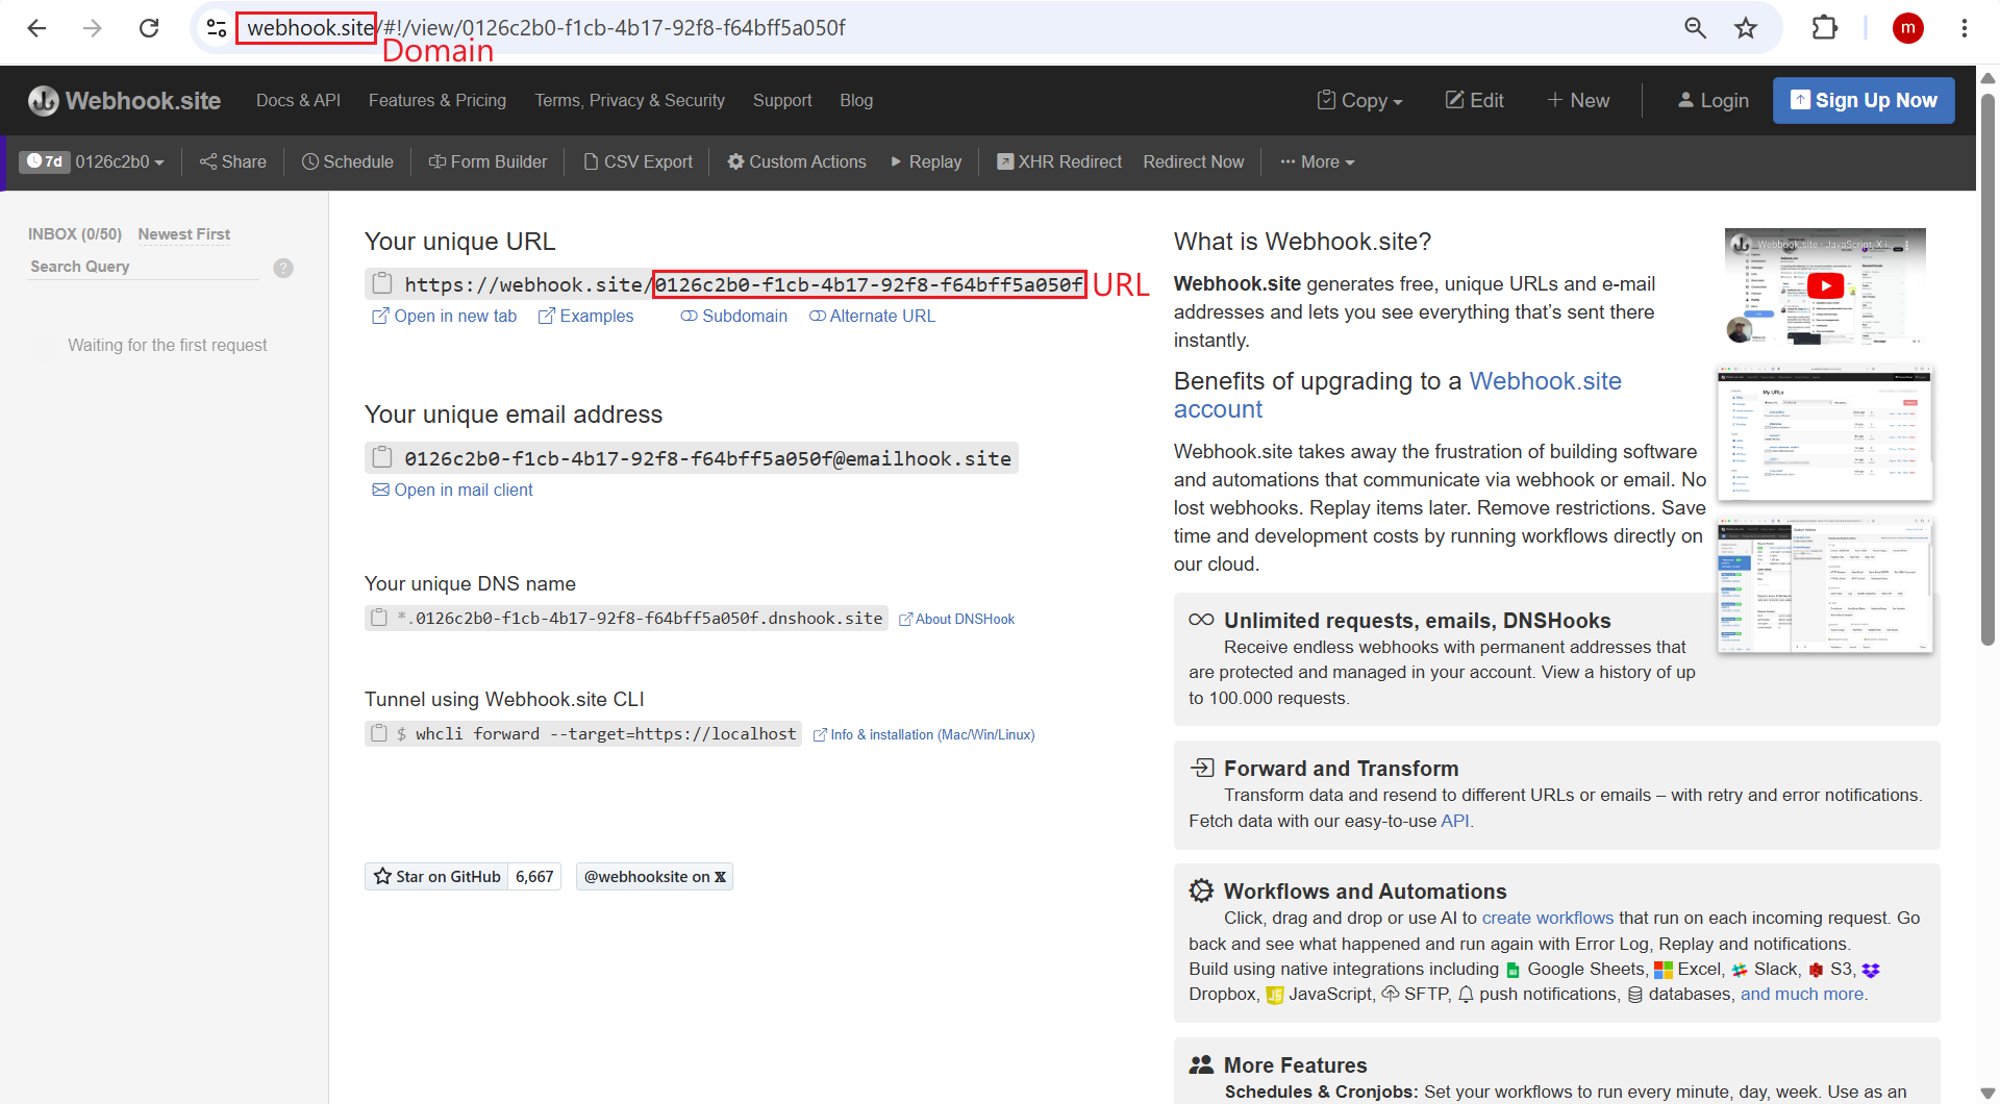
Step 4. In the pop-up window, enter the information related to the third-party server. In this article, https://webhook.site/#!/ is used as the reference server.
Step 5. Enter the third-party server’s Host IP or Domain and URL, select the appropriate protocol (HTTP or HTTPS), and specify the corresponding port number from 1 to 65535. In this article, the HTTP protocol and port 80 are used for the configuration demonstration. You can also choose whether to include an attached image in the reported event message. Finally, click Save to apply and store the configuration.
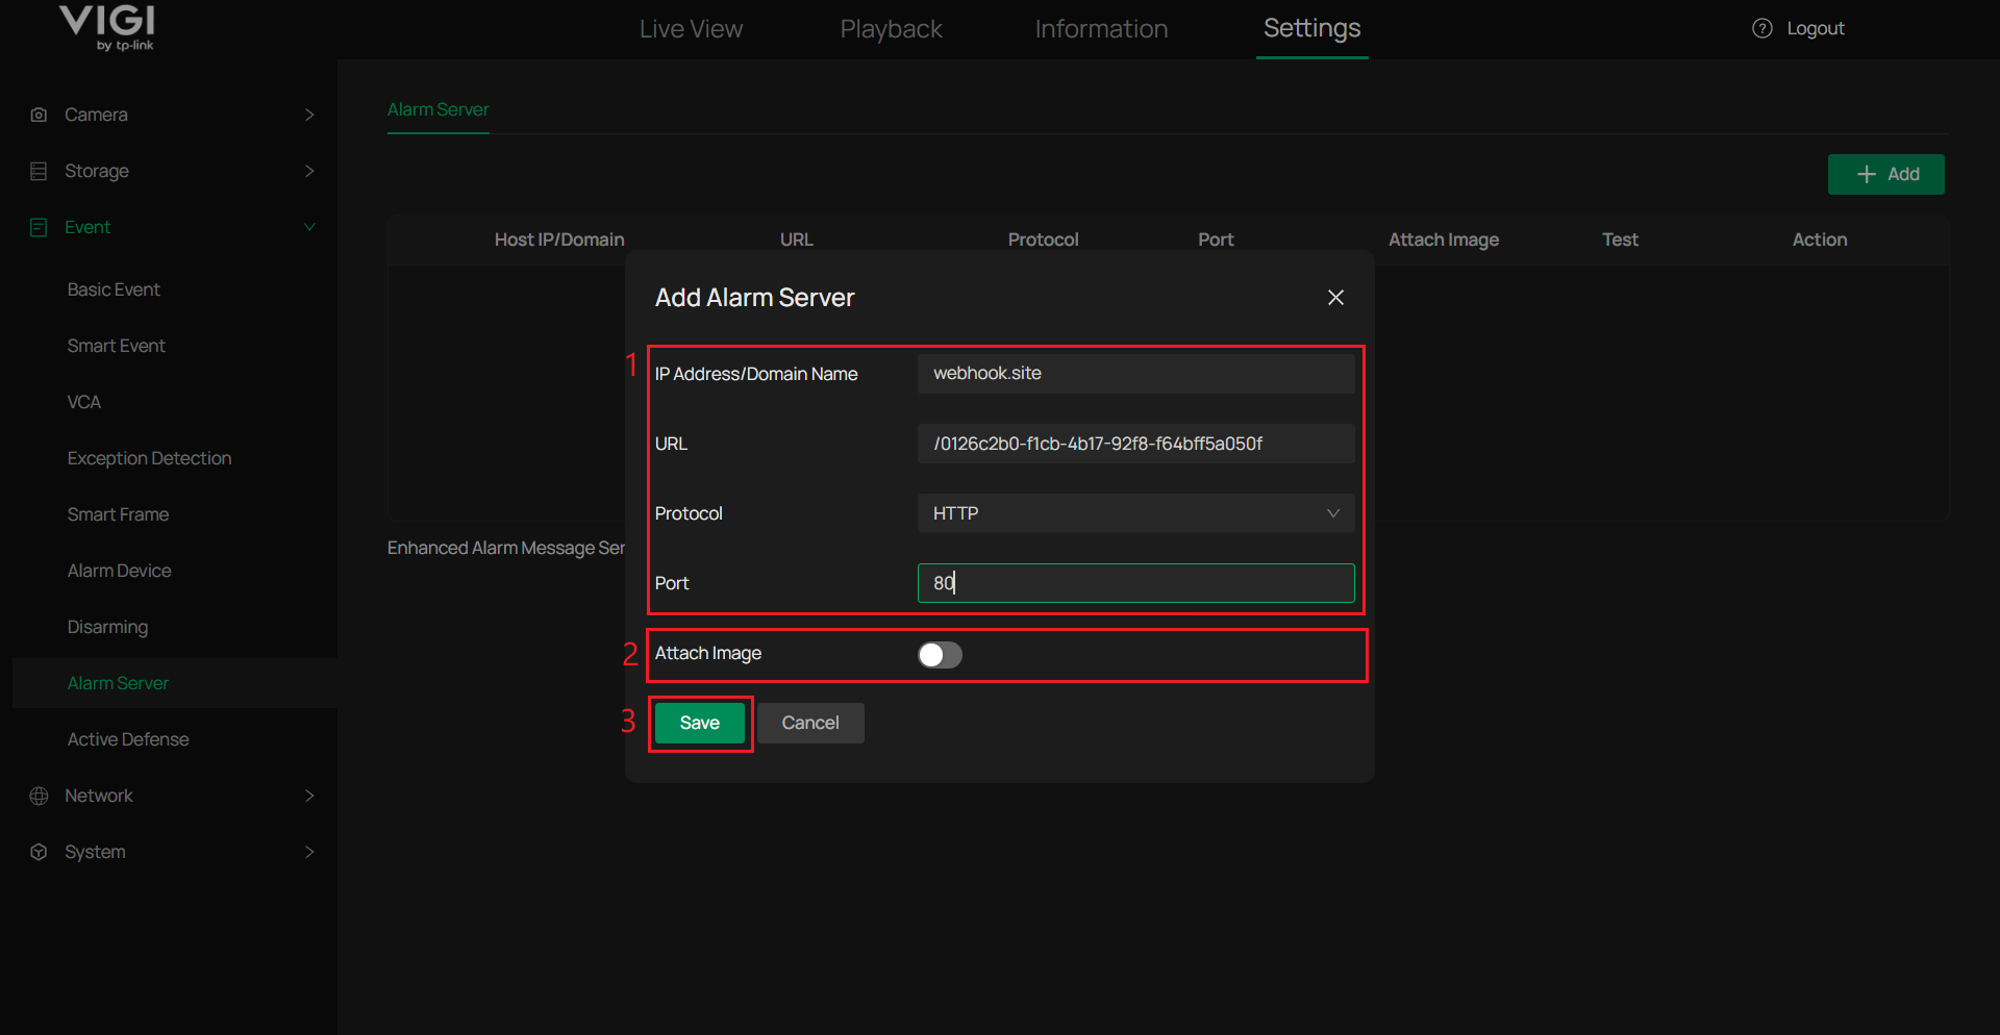
Note:
1. In the configuration parameters, Host IP/Domain refers to the IP address or domain name of the server, which in this article is webhook.site.
2. The URL corresponds to the URL path used in the HTTP messages exchanged between the device and the server. In this document, the server’s default URL /0126c2b0-f1cb-4b17-92f8-f64bff5a050f) is used.
3. Enhanced Alarm Message Service is supported following firmware updates for NVRs. After this function is enabled, the Alarm Server can include more detailed alarm information in the reported alarm messages, such as enhanced event-related fields or additional event attributes. This helps third-party platforms obtain richer alarm information for further processing.
Please note that after enabling this function, the alarm message format may be different from the previous format. Therefore, if your third-party server has already implemented alarm message parsing logic, you may need to adjust the corresponding parsing rules accordingly.
For the differences in the alarm message format before and after enabling this switch, please refer to the second Q&A in the Q&A section.
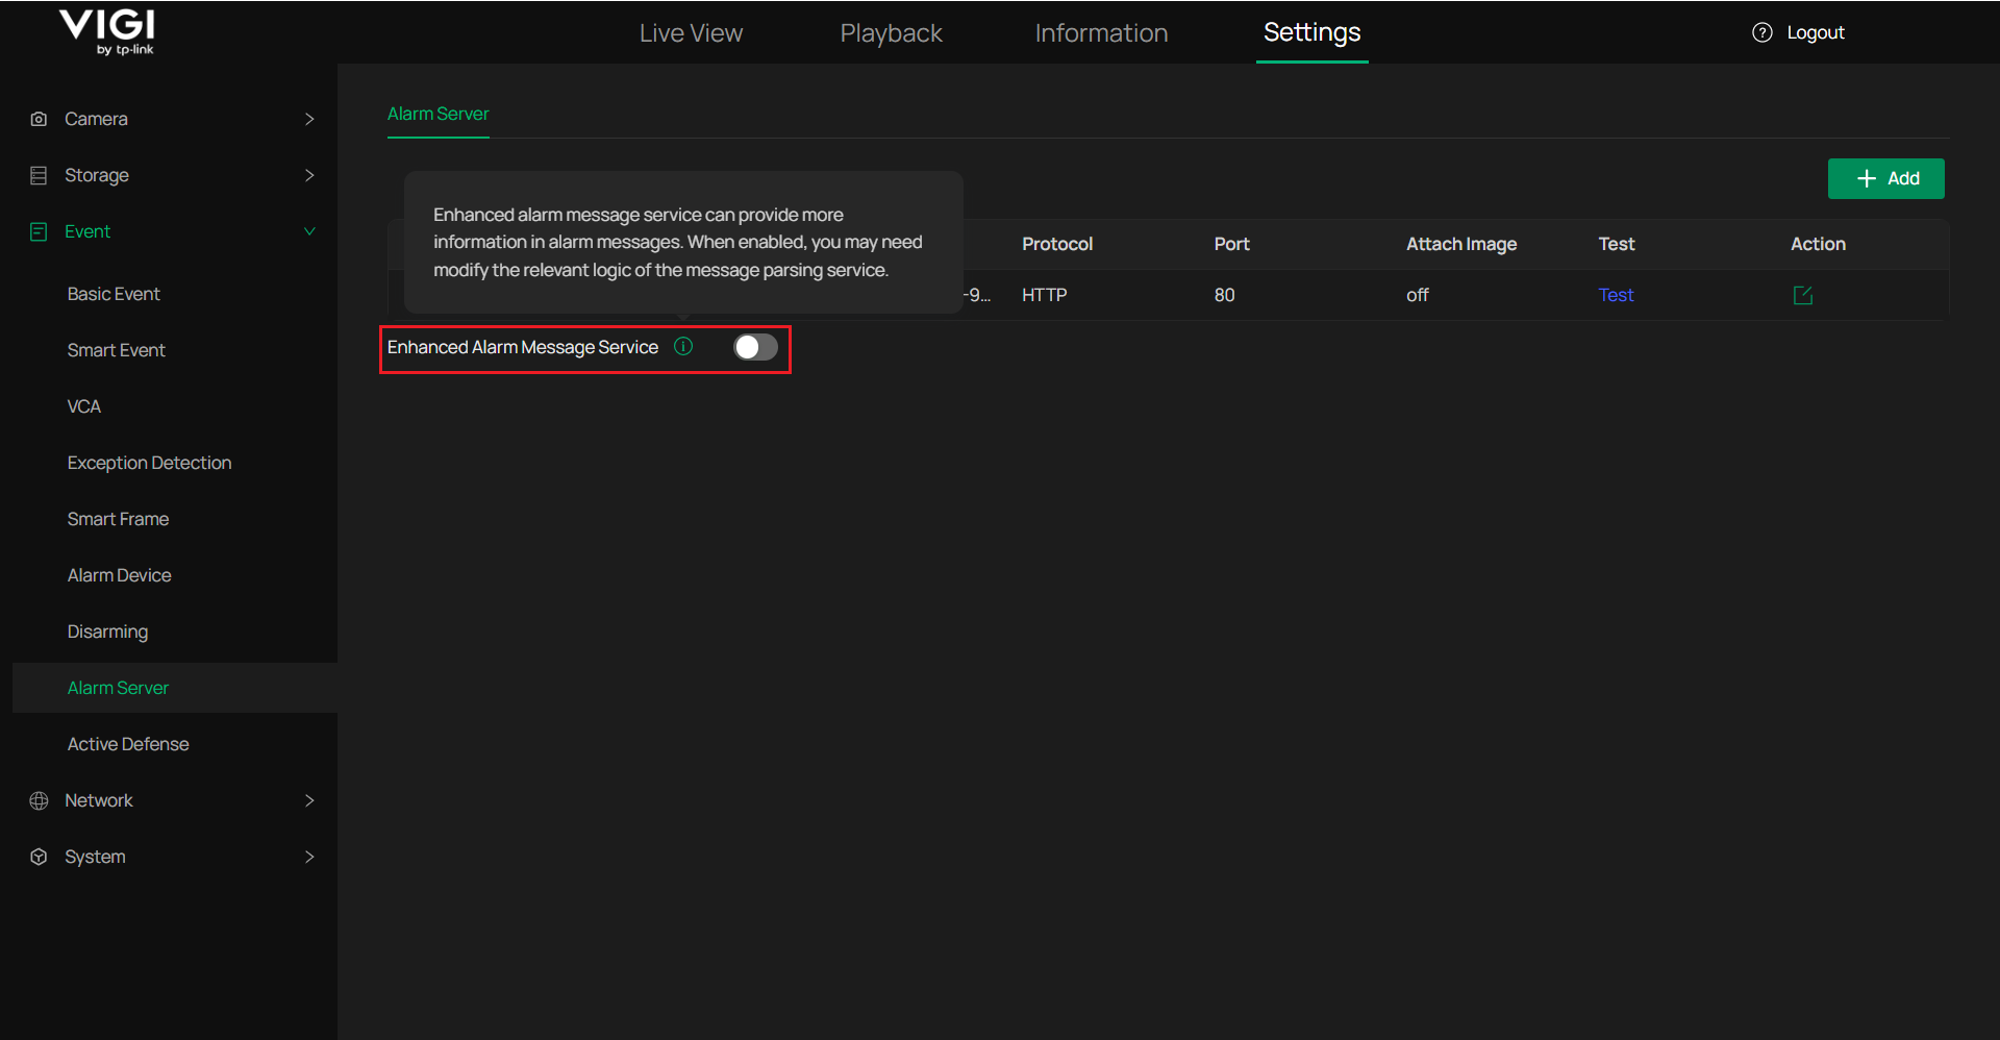
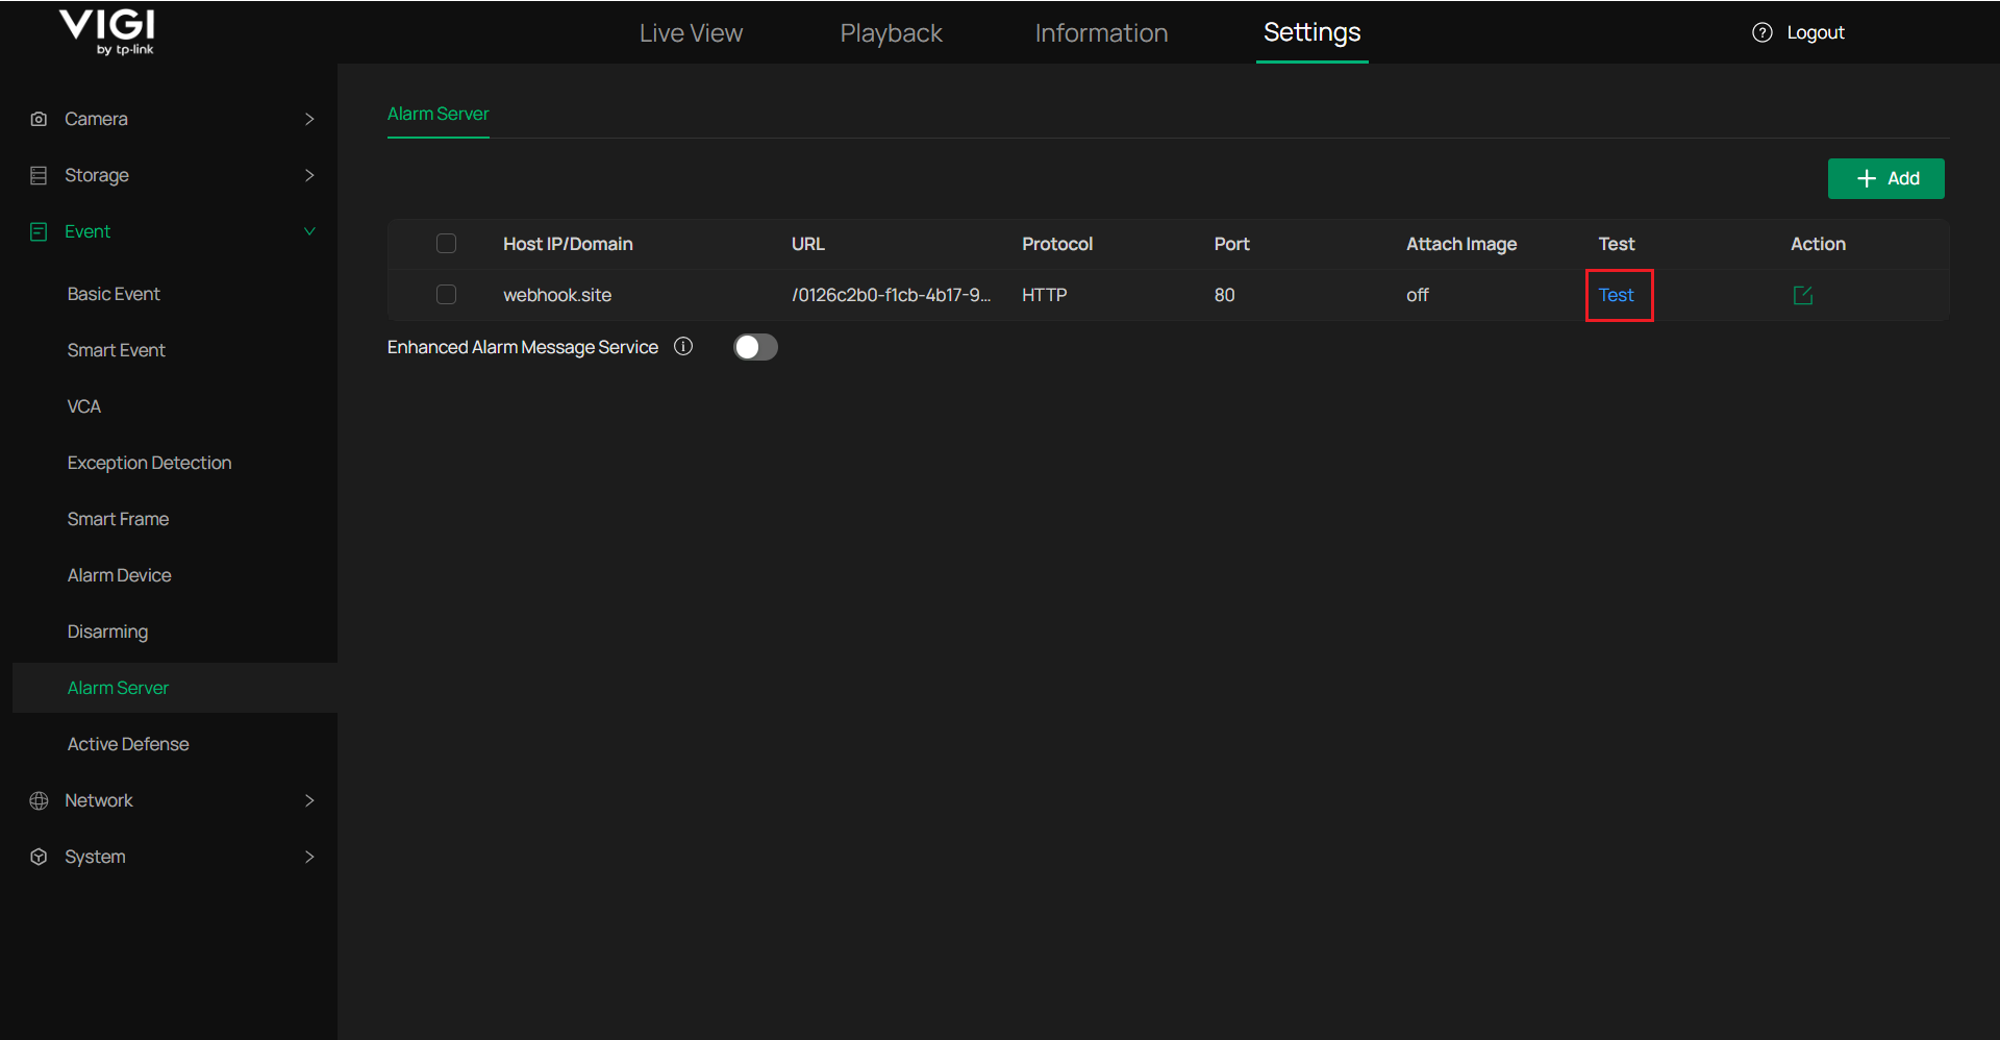
Step 6. You can click the “Test” button to check the connection status between the device and the server.
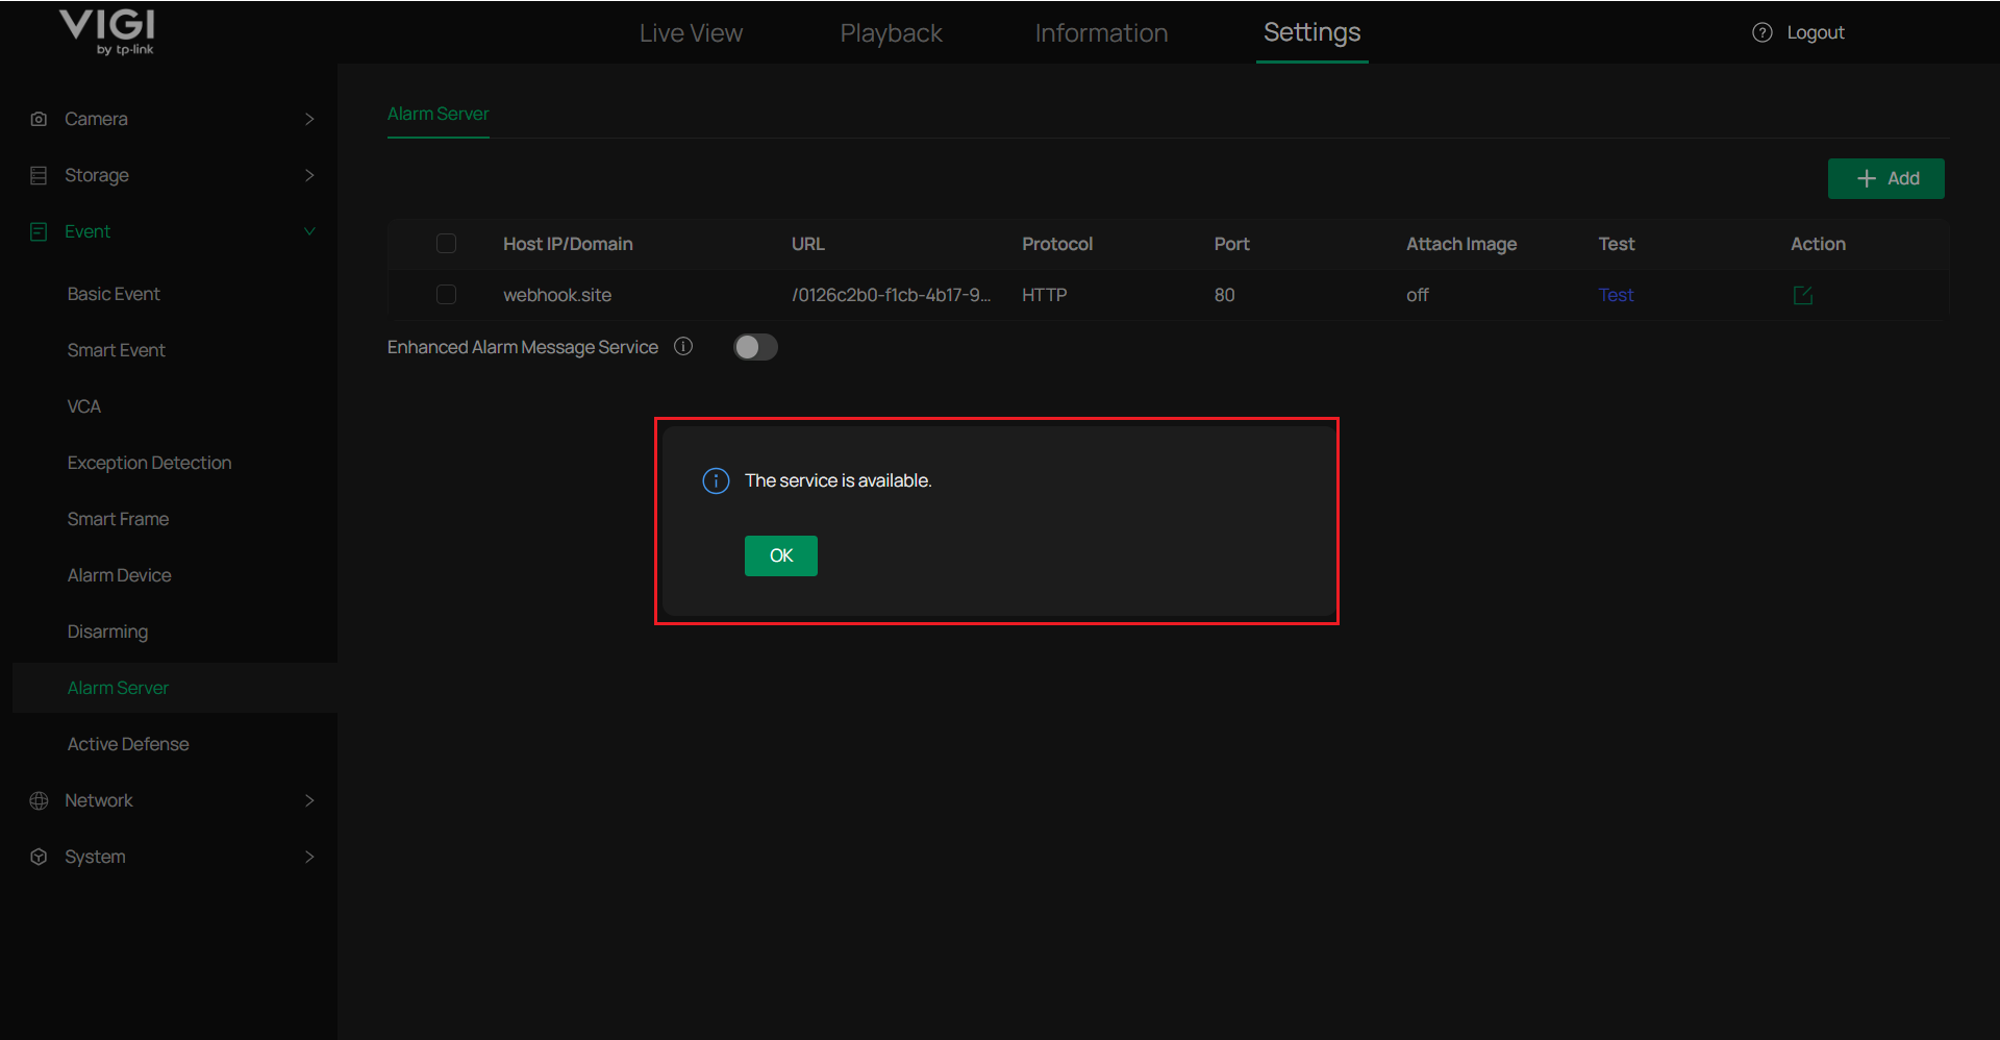
Step 7. When a pop-up message displays “The service is available”, it indicates that the connection status is normal and the function is operating properly. Click OK to proceed.
Step 8. Navigate to Settings > Event > Smart Event > Human Detection, select the desired channel, enable human detection function.
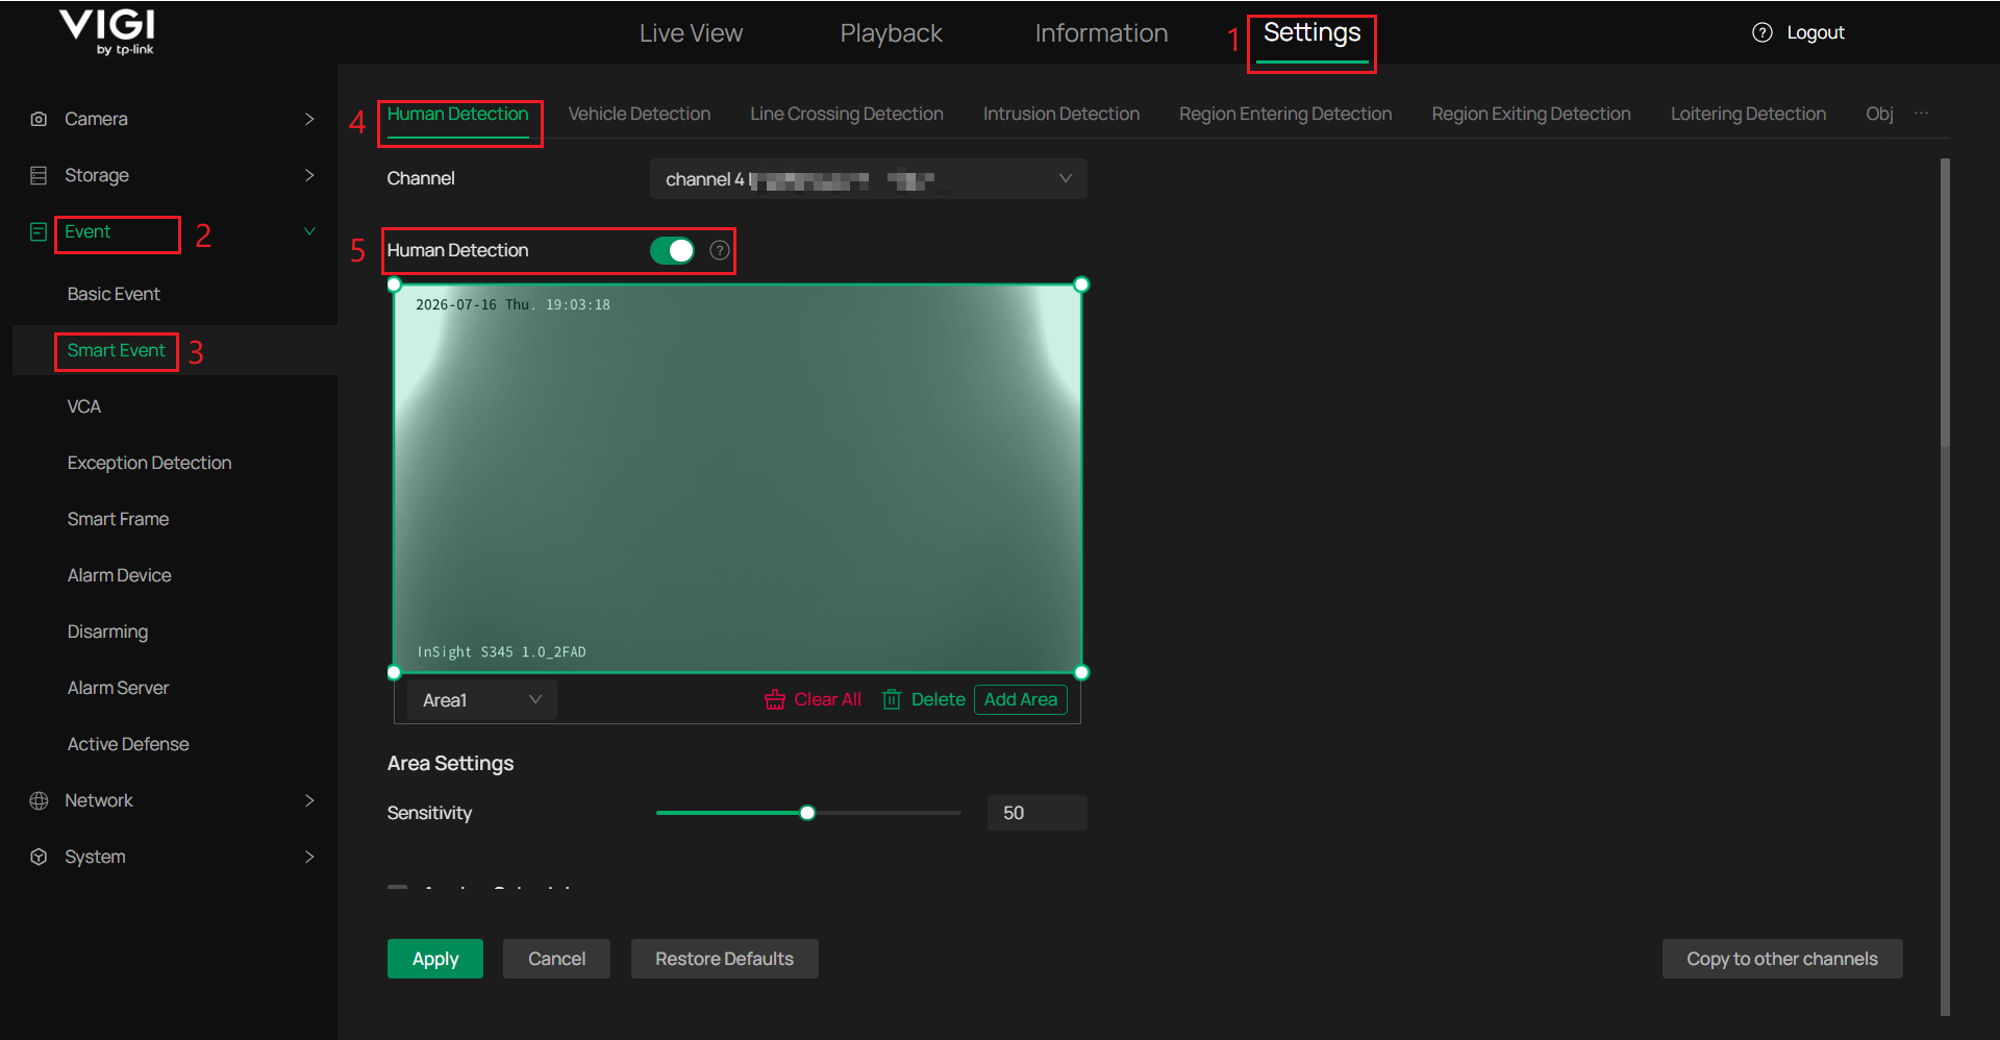
Note: This article uses Human Detection as an example for demonstration purposes. Other event detection functions will also take effect in the same manner.
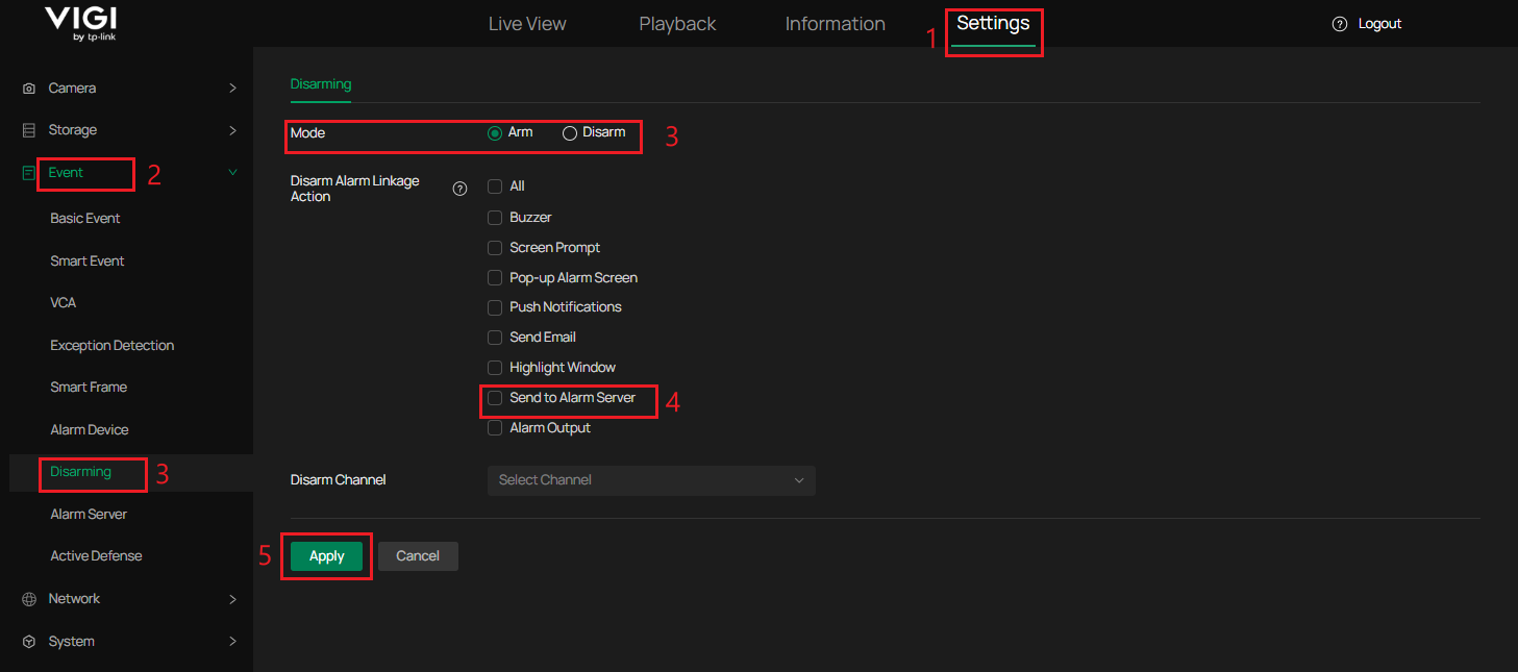
Step 9. Check the Disarming settings.
Navigate to Settings > Event > Disarming, and check the following settings:
- If Mode is set to Arm, no further changes are required.
- If Mode is set to Disarm, make sure Send to Alarm Server is not selected under Disarm Alarm Linkage Action. Any action selected in this section is disabled while the NVR is disarmed.
Click Apply to save the settings.
Note: The Send to Alarm Server option on the Disarming page is available only on certain models running supported firmware versions. By default, Mode is set to Arm. If the Send to Alarm Server option is unavailable, the NVR sends all events to the Alarm Server by default.
Verification
Step 1. Configure port mirroring on the switch to mirror the port connected to the VIGI NVR to the port connected to the laptop. Start packet capture on the laptop’s network interface using Wireshark and then trigger the Human Detection event.
Step 2. Verify the information reported by the VIGI NVR.
Scenario 1. Without attached image
Step 1. Enter “http” in the Wireshark display filter bar to display the captured HTTP packets. Then check the HTTP POST Request and HTTP Response.

Step 2. Check the HTTP POST Request Headers
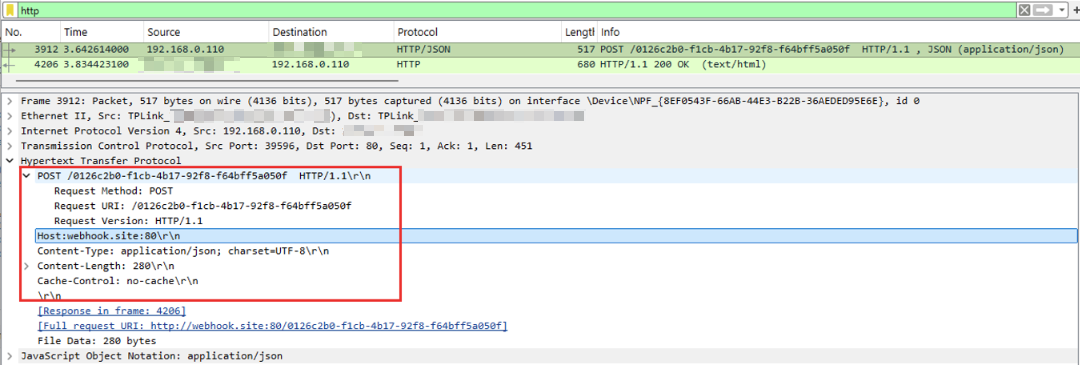
Note: The first line contains the POST method, the request target URI, and HTTP version 1.1. The URI corresponds to the URL string configured previously in the Alarm Server settings.
From the second line up to the blank line, each line represents a key–value pair that describes the request metadata. These include Host, Content-Type, Content-Length, and Cache-Control.
When the Content-Type is set to application/json, it indicates that only the event message is pushed (without attached image), and the request body is a JSON-formatted string.
Each line ends with \r\n. A blank line consisting only of \r\n indicates the end of the request headers and the beginning of the request body.
Step 3. Check the HTTP POST Request Body
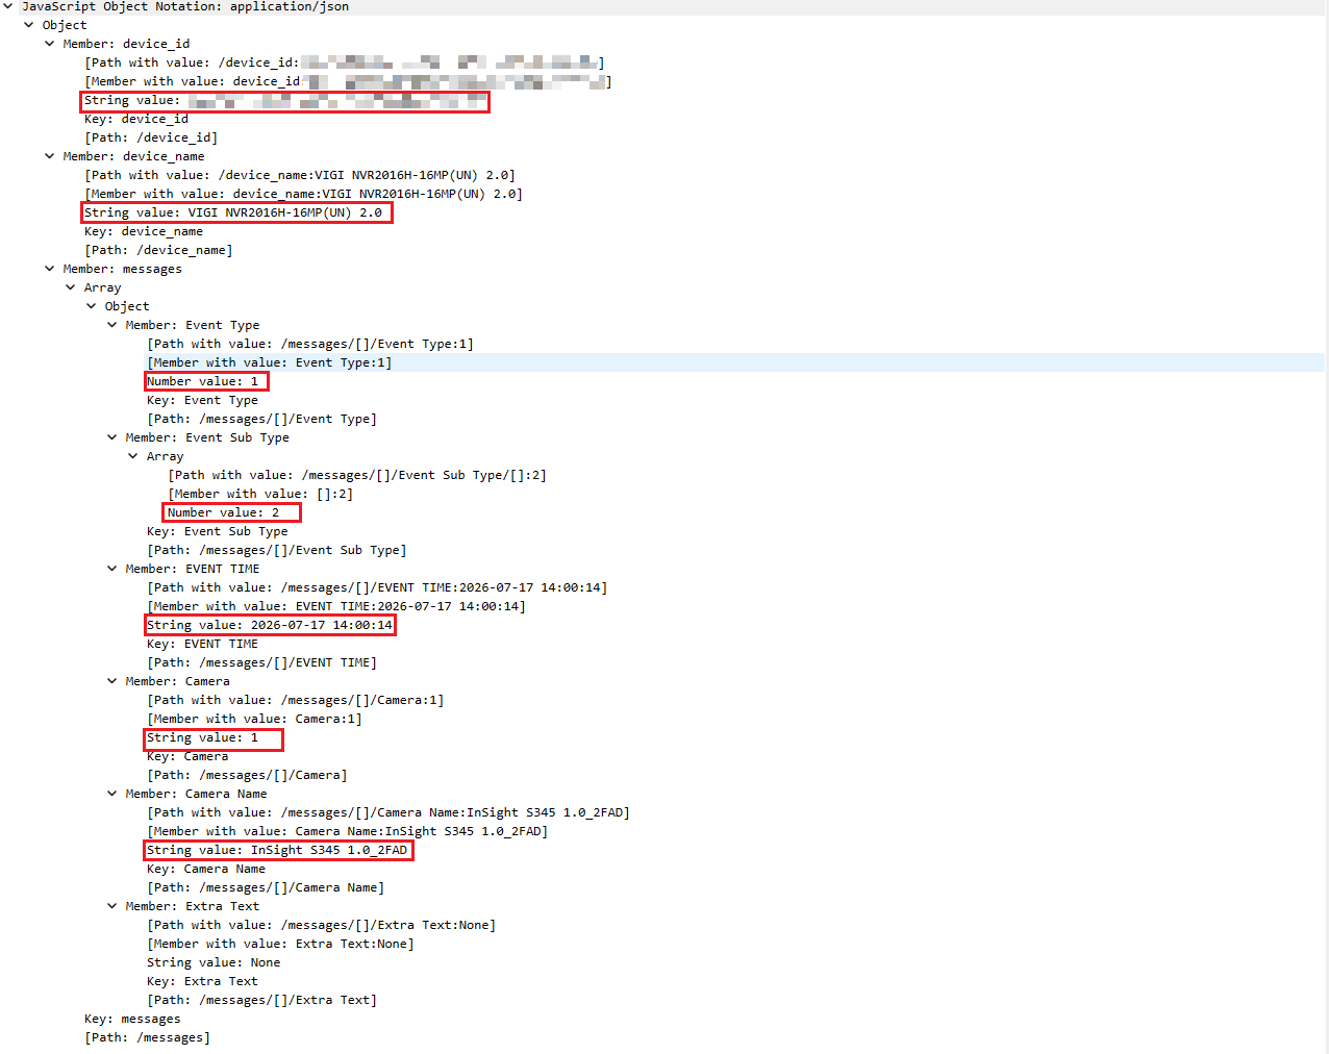
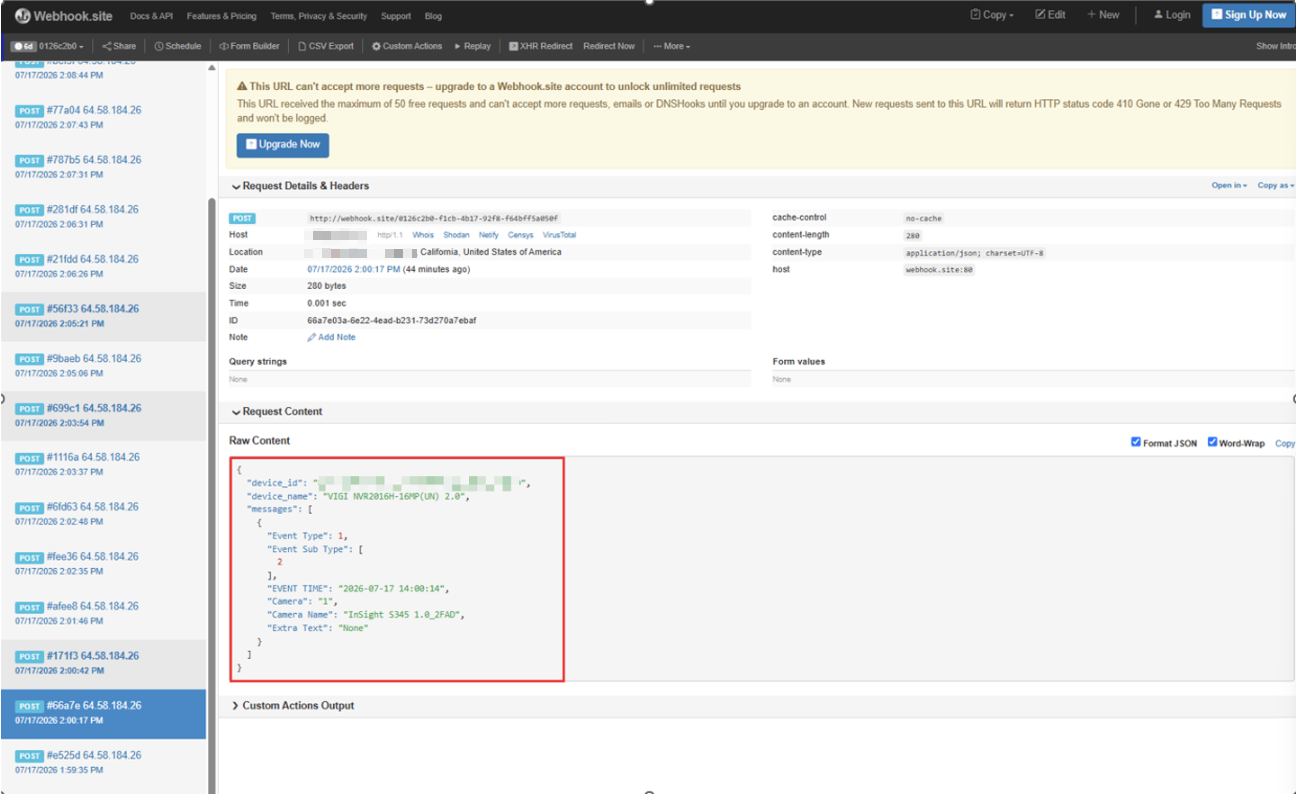
Note: In the JSON payload, device_id represents the unique ID of the NVR reporting the event, and device_name specifies the name of the reporting NVR. The messages field is an array containing the reported events. Within messages, Event Type indicates the triggered event type, Event Sub Type indicates the triggered event subtype, EVENT TIME indicates when the event occurred, Camera indicates the channel that triggered the event, Camera Name specifies the name of the triggered channel, and Extra Text is reserved for additional information.
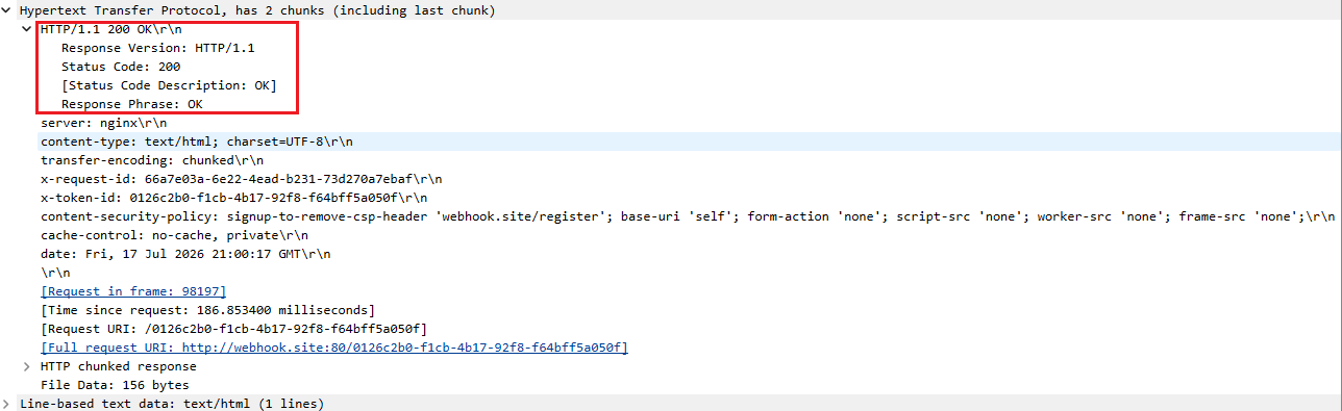
Step 4. Check the HTTP Response. A returned 200 OK status code indicates that the webhook.site server has successfully received and processed the request.
Step 5. Compare the data reported in the HTTP POST Request Body with the data received and parsed by the webhook.site server to verify whether they are consistent.
Scenario 2. With attached image
Step 1. Before starting packet capture, click the Edit button in the upper-right corner of the webhook.site server page, and modify the Content-Type for messages with attached images to multipart/form-data; boundary=ReportEventBoundary.
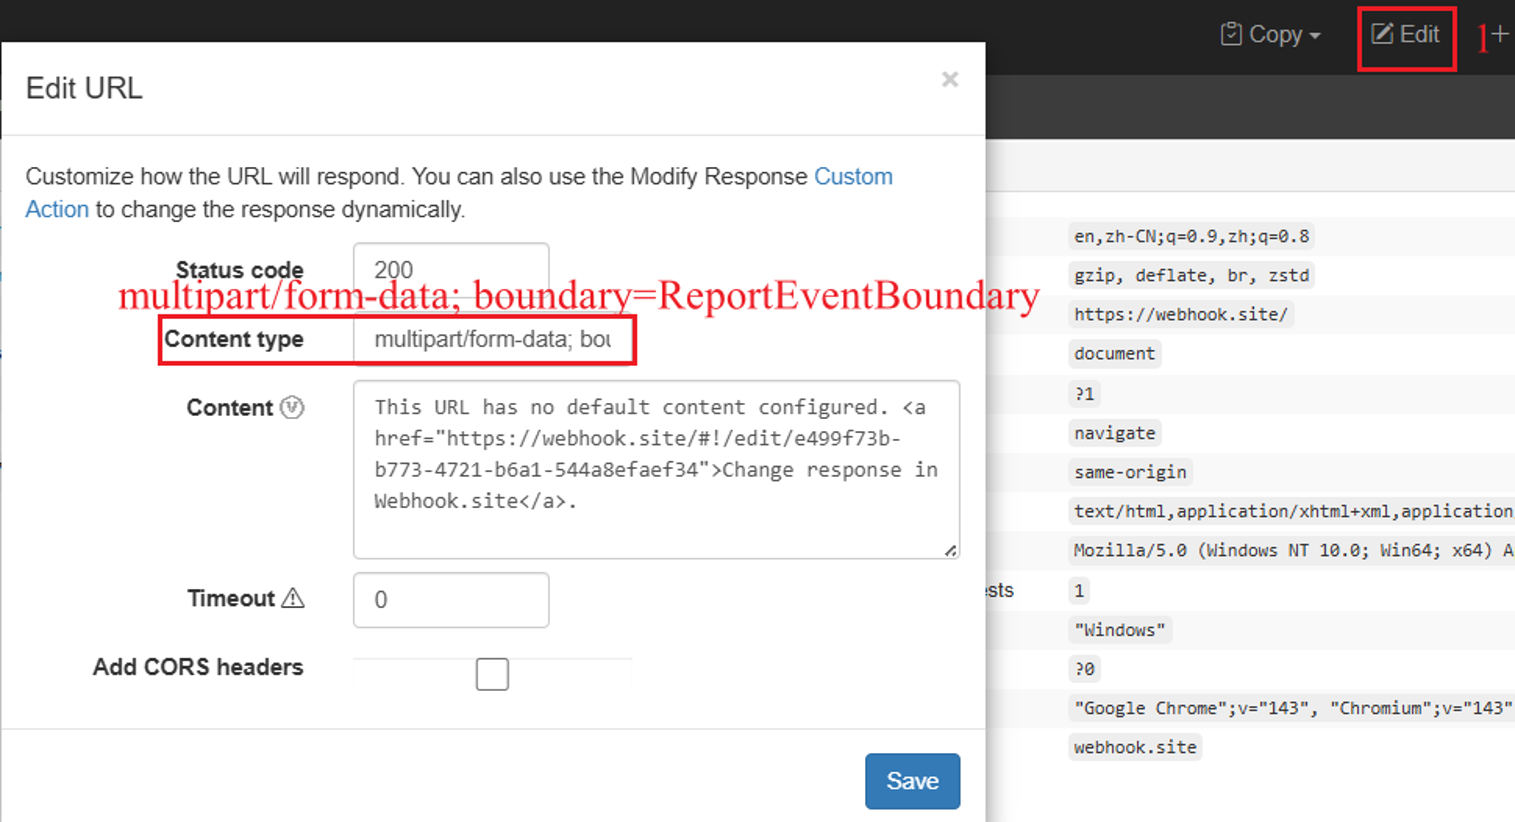
Note: multipart/form-data allows multiple data parts, such as JSON event information and a JPEG snapshot, to be included in the same HTTP request body.boundary = ReportEventBoundary specifies the boundary used to separate different parts of the data payload.
Step 2. Use “http” command to filter the captured packets. Then check the HTTP POST Request Headers and Body.
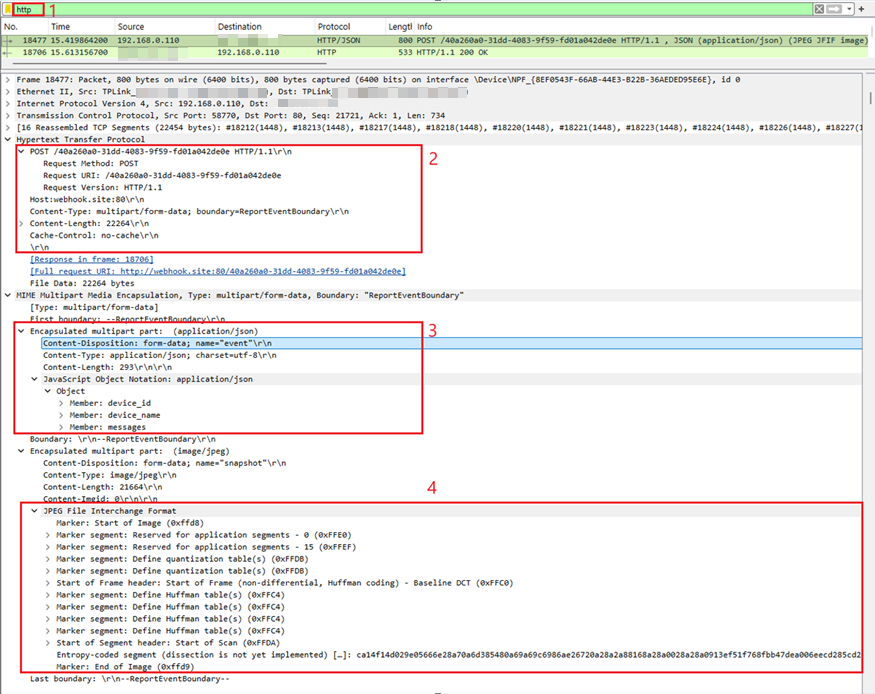
Note: The request body starts after a blank line (\r\n). Since the Content-Type is multipart/form-data, the body is divided into multiple parts, each separated by the boundary --ReportEventBoundary. The request body ends with --ReportEventBoundary--.
The first part has name="event" and contains the JSON event data. The second part uses name="snapshot" and contains the JPEG snapshot data. For each part, Content-Type specifies the data format, while Content-Length specifies the size of the corresponding content in bytes.
The JPEG data shown in Wireshark represents the binary content of the snapshot image.
Step 3. Check the HTTP Response. A returned 200 OK status code indicates that the webhook.site server has successfully received and accepted the request.
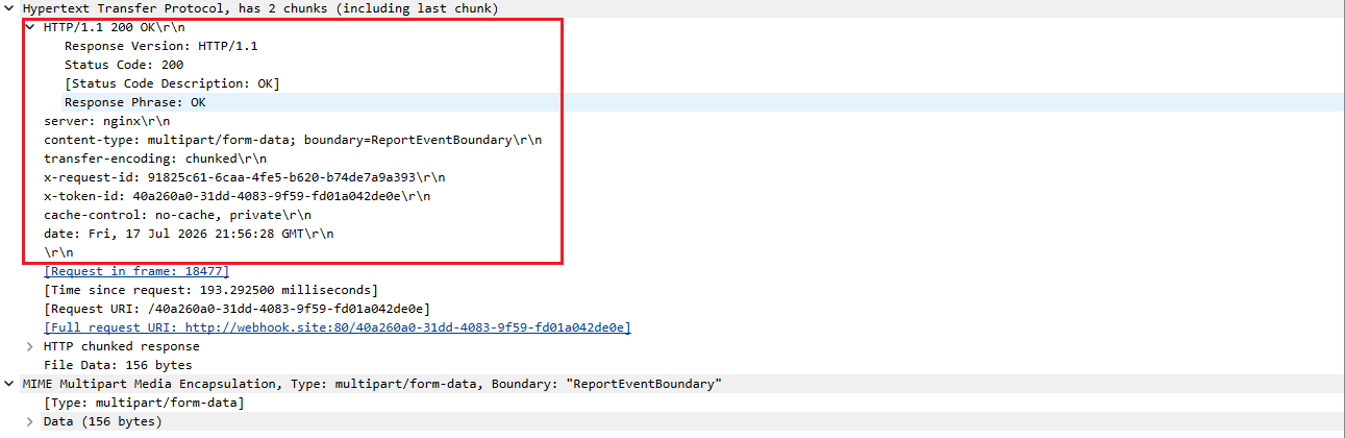
Step 4. Compare the data reported in the HTTP POST Request Body with the data received and parsed by the webhook.site server to verify whether they are consistent.
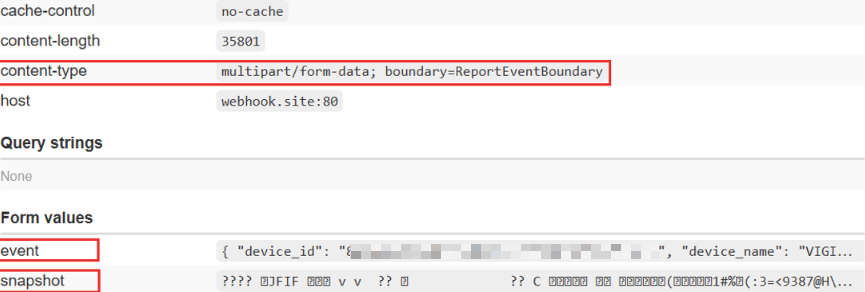
Note: webhook.site server itself does not parse or decode the uploaded image content. It only receives and displays the HTTP request data. Therefore, only the event information and the corresponding image timestamp are visible.
Event Type and Event Subtype Values
The Event Type and Event Subtype fields use numeric values to identify the category and specific type of each reported event. Refer to the following tables for the supported values.
|
Event Type Value |
Event Subtype Value |
Description |
|
1 |
2 |
Motion Detection |
|
2, 101 |
Motion Detection/Person |
|
|
2, 102 |
Motion Detection/Vehicle |
|
|
3 |
Tamper Detection |
|
|
4 |
Line Crossing Detection |
|
|
4, 101 |
Line Crossing Detection/Person |
|
|
4, 102 |
Line Crossing Detection/Vehicle |
|
|
5 |
Intrusion Detection |
|
|
5, 101 |
Intrusion Detection/Person |
|
|
5, 102 |
Intrusion Detection/Vehicle |
|
|
6 |
Region Entering Detection |
|
|
6, 101 |
Region Entering Detection/Person |
|
|
6, 102 |
Region Entering Detection/Vehicle |
|
|
7 |
Region Exiting Detection |
|
|
7, 101 |
Region Exiting Detection/Person |
|
|
7, 102 |
Region Exiting Detection/Vehicle |
|
|
8 |
Loitering Detection |
|
|
8, 101 |
Loitering Detection/Person |
|
|
8, 102 |
Loitering Detection/Vehicle |
|
|
14 |
Abnormal Sound Detection |
|
|
16 |
Scene Change Detection |
|
|
19 |
Video Loss |
|
|
21 |
Human Detection |
|
|
22 |
Vehicle Detection |
|
|
23 |
Object Abandoned/Removal Detection |
|
|
38 |
IPC Alarm In Detection |
|
|
39, 103 |
Queue Detection - Number of People Threshold Reached |
|
|
39, 104 |
Queue Detection - Number of People and Waiting Time Thresholds Reached |
|
|
2 |
3 |
Hard Drive Missing |
|
4 |
Hard Drive Full |
|
|
7 |
Hard Drive Exception |
|
|
8 |
Login Exception |
|
|
9 |
POE Single Port Shortcut |
|
|
10 |
POE Single Port Overload |
|
|
11 |
POE Chip Temperature Error |
|
|
12 |
POE Total Overload |
|
|
13 |
NVR Alarm In Detection |
|
|
14 |
Fan Working Abnormally |
|
|
15 |
NVR IP Conflict |
|
|
17 |
IPC IP conflict |
|
|
18 |
Hard Drive Unavailable Due to Damage |
|
|
7 |
1 |
RAID Array Failed |
|
2 |
RAID Array Degraded |
|
|
3 |
RAID Array Recovered Using a Hot Spare |
|
|
4 |
Hot Spare Failed |
|
|
5 |
No RAID Array Available |
|
|
6 |
RAID Array Full |
|
|
7 |
No Disk |
|
|
8 |
Hard Drive Password Error |
|
|
9 |
RAID password error |
|
|
10 |
External Hard Drive Password Error |
Note:
- The fields included in an Alarm Server message vary depending on the reported event. All messages include the event type, event subtype, and event time. Only notifications with Event Type 1 include the triggered channel number and channel name. After Enhanced Alarm Message Service is enabled, these fields are displayed as Event Type, Event Sub Type, EVENT TIME, Camera, and Camera Name, instead of the original field names type, sub_type, localtime, channel, and channel_name.
- Certain device exception events include an additional value identifying the component that triggered the event. The meaning of this value depends on the reported Event Type and Event Subtype, as shown below.
|
Event Type |
Event Subtype |
Additional Information |
Description |
|
2 |
3, 4, or 7 |
Disk ID |
Hard drive that triggered the event |
|
7 |
8 |
Disk ID |
Hard drive that triggered the event |
|
2 |
9 or 10 |
PoE Port Number |
PoE port that triggered the event |
|
2 |
13 |
Alarm Input ID |
Alarm input that triggered the event |
|
7 |
1, 2, 3, 4, 6, or 9 |
RAID Array ID |
RAID array that triggered the event |
|
7 |
10 |
External Hard Drive ID |
External hard drive that triggered the event |
- The following RAID-related events are available only on NVR models that support RAID: RAID Array Failed, RAID Array Degraded, RAID Array Recovered Using a Hot Spare, Hot Spare Failed, No RAID Array Available, RAID Array Full, and RAID Password Error.
- The following PoE-related events are available only on NVR models that support PoE: PoE Single-Port Short Circuit, PoE Single-Port Overload, PoE Chip Temperature Error, and PoE Total Overload.
Conclusion
You have now configured the Alarm Server feature. When a configured event is triggered, the VIGI NVR reports the event information and, if enabled, the corresponding snapshot to the Alarm Server.
QA
Q1: If the Alarm Server has been configured successfully but no alarm data is received by the server when an event is triggered, what should I do?
A1: Please perform the following checks:
Step 1. Perform a preliminary configuration check. Review the NVR logs to confirm that the event was detected and triggered. VIGI NVRs do not require separate Alarm Server reporting settings for individual channels. For settings that may prevent events from being reported while the NVR is disarmed, refer to Step 9. Check the Disarming settings. Also verify all Alarm Server configuration parameters. Verify that the server is listening on the configured port and that the configured URL exactly matches the server endpoint.
Step 2. Configure port mirroring and capture packets from the device side, then check the following items sequentially:
- TCP Connection: Verify whether the TCP three-way handshake between the device and the server is successfully established.
- HTTP POST Request: Confirm that the POST request is initiated successfully and that the request header format is correct. Pay particular attention to the Content-Type field. When only event information is reported, the Content-Type should be application/json. When a snapshot image is included, the Content-Type should be multipart/form-data, and the mixed data (JSON string and image data) must be separated using boundary=ReportEventBoundary.
- HTTP Response: Check the HTTP response status code returned in the packet to confirm whether the server responds to the HTTP request correctly.
Q2: What is the difference in the alarm message format before and after enabling Enhanced Alarm Message Service?
A2: After Enhanced Alarm Message Service is enabled, an additional Extra Text field is included in the Alarm Server message. If your third-party server uses parsing logic based on the previous format, review and update it if necessary. See the comparison below for details.
Before enabling Enhanced Alarm Message Service:
|
Property |
Description |
Value |
|
type |
Triggered event type |
event_type: {Event Type} |
|
sub_type |
Triggered event subtype |
event_sub_type: {Event Sub Type} |
|
localtime |
Event timestamp |
datetime: {YYYY-MM-DD HH:MM:SS} |
|
channel |
Triggered channel |
camera_number: {Camera Number} |
|
channel_name |
Triggered channel name |
camera_name: {Camera Name} |
After enabling Enhanced Alarm Message Service:
|
Property |
Description |
Value |
|
Event Type |
Triggered event type |
event_type: {Event Type} |
|
Event Sub Type |
Triggered event subtype |
event_sub_type: {Event Sub Type} |
|
EVENT TIME |
Event timestamp |
datetime: {YYYY-MM-DD HH:MM:SS} |
|
Camera |
Triggered channel |
camera_number: {Camera Number} |
|
Camera Name |
Triggered channel name |
camera_name: {Camera Name} |
|
Extra Text |
Additional information |
The default value is None. Reserved for extension. |
To learn more about each function and configuration, please visit Support Home to download or check the manual for your product.
Looking For More
هل تجد هذه الأسئلة مفيدة؟
مشاركتك تساعدنا في تحسين الموقع

1.0-A-package_normal_20231211023159r.png)


TP-Link Community
Still need help? Search for answers, ask questions, and get help from TP-Link experts and other users around the world.